Advanced Financial Charts
and Technical Analysis Tools for Asset Managers


Customizable, Interactive and User-Friendly Charting Tool
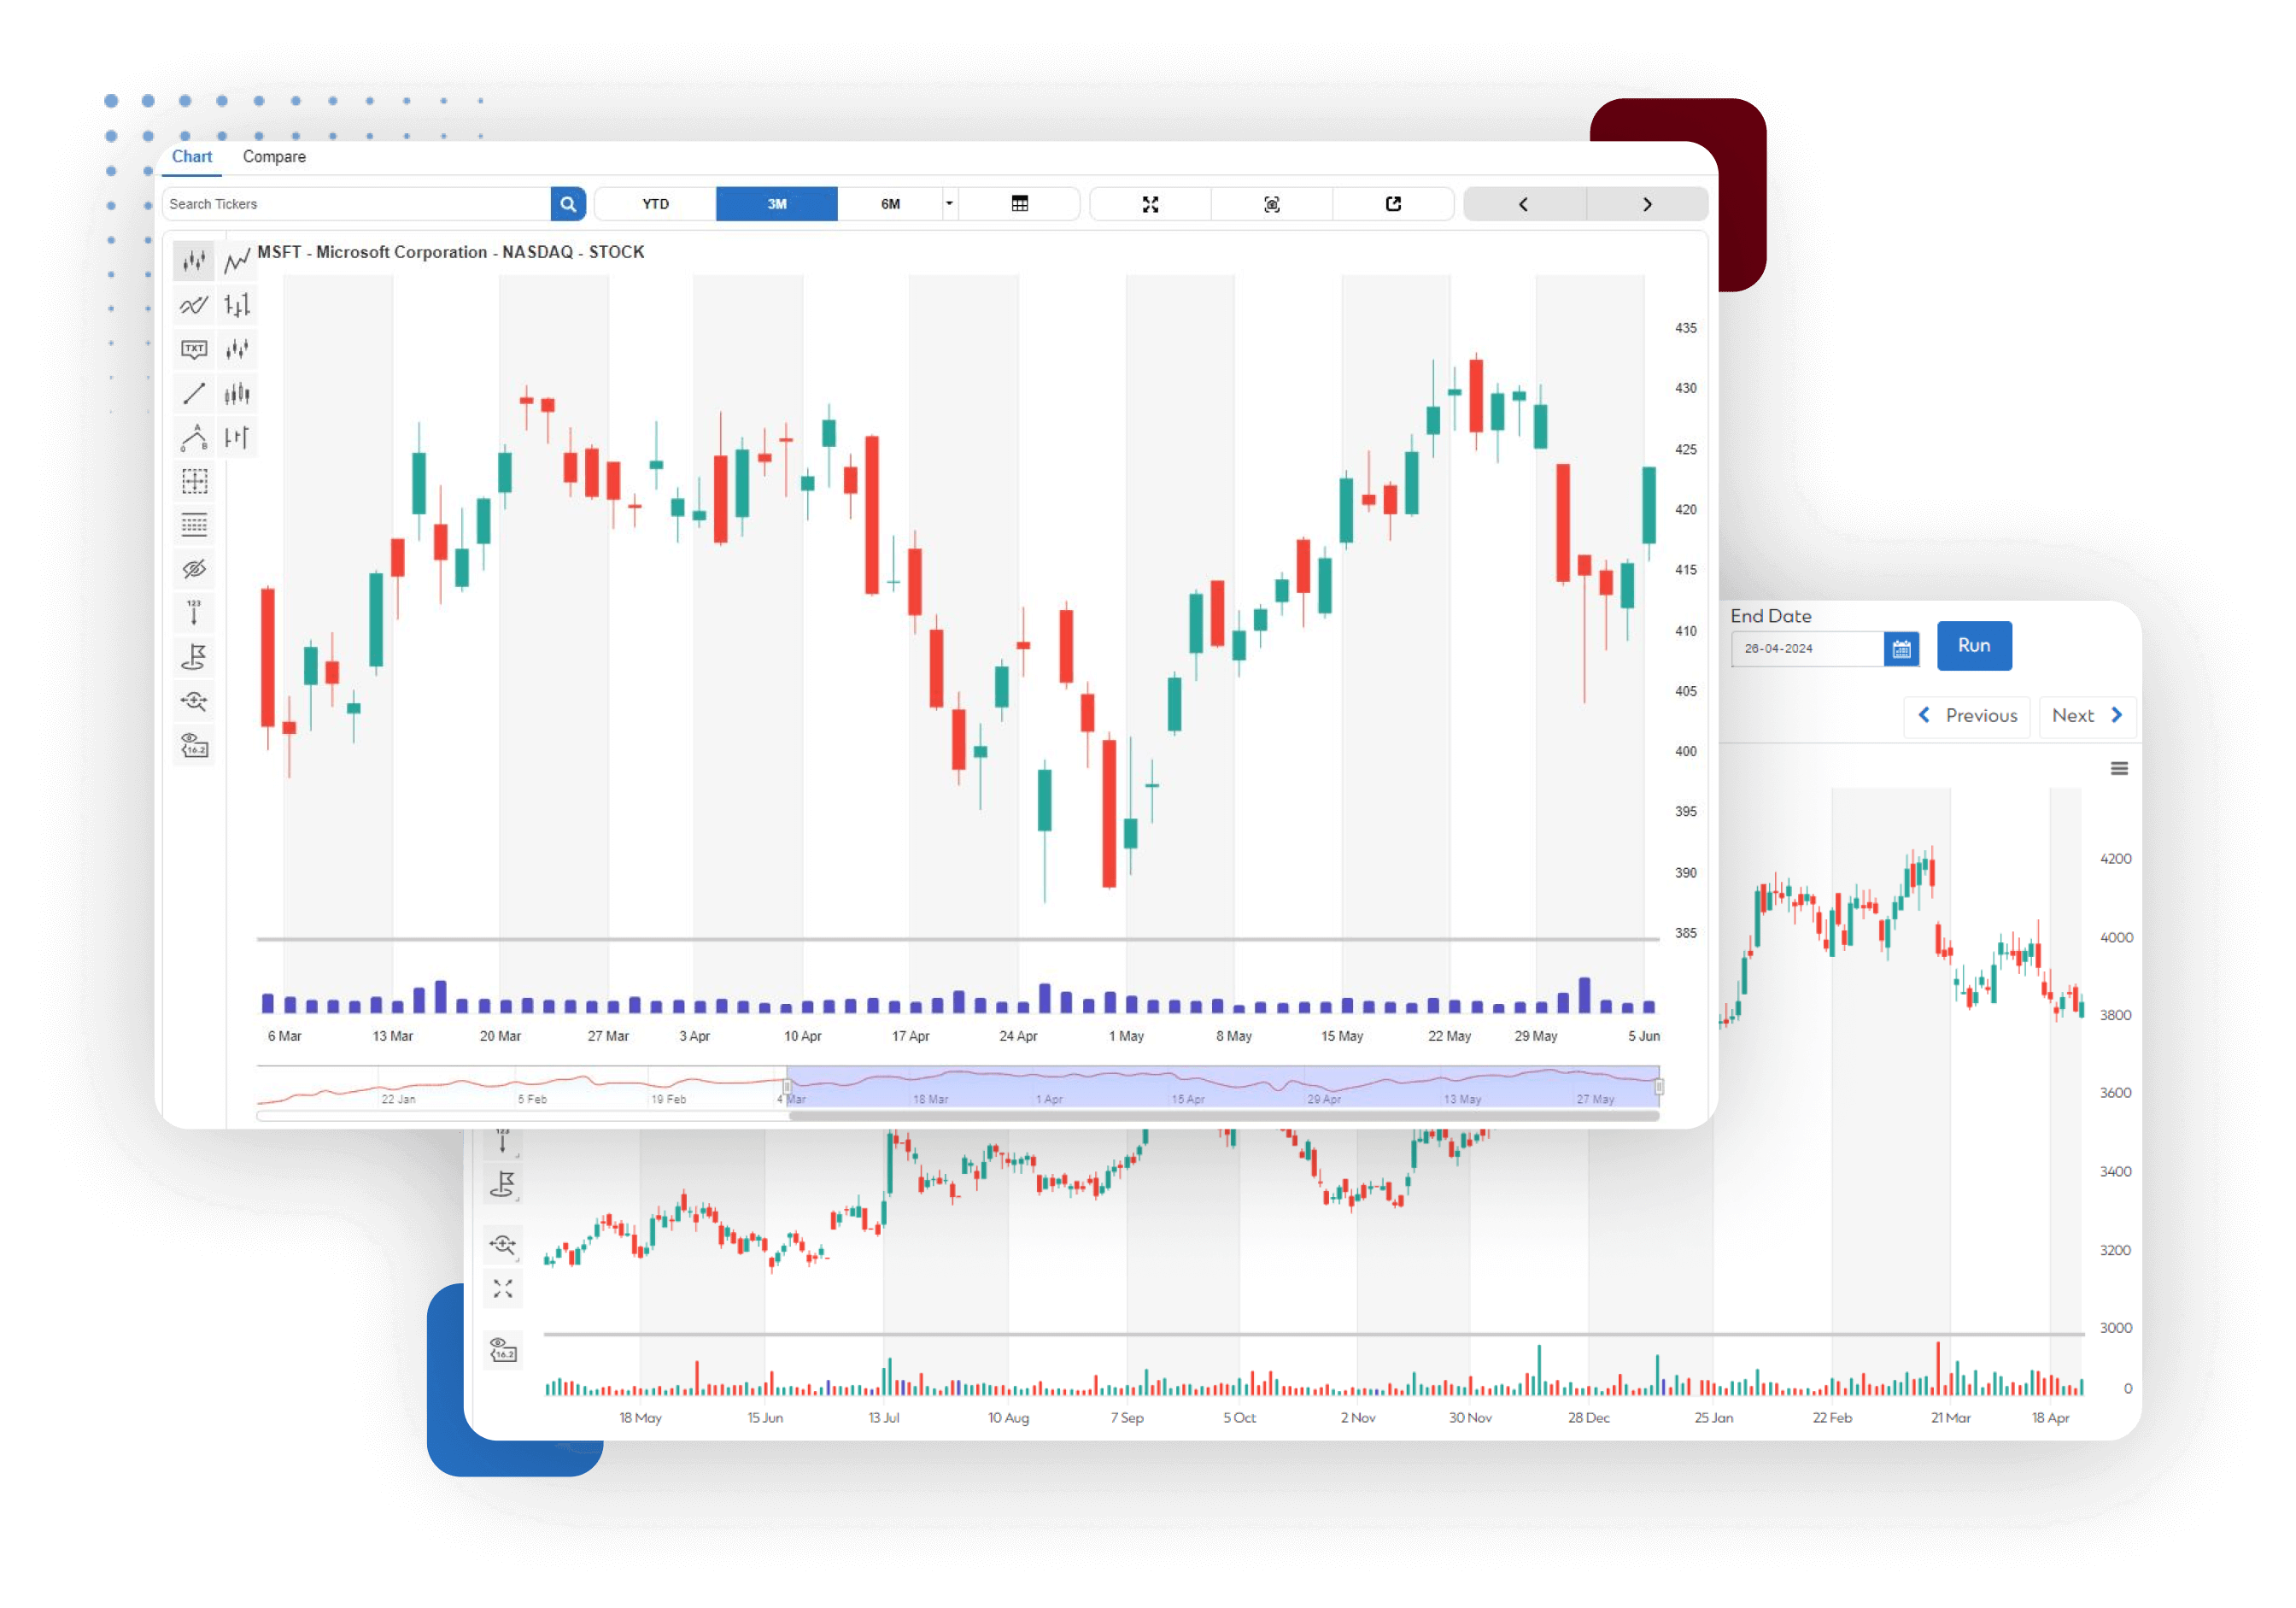
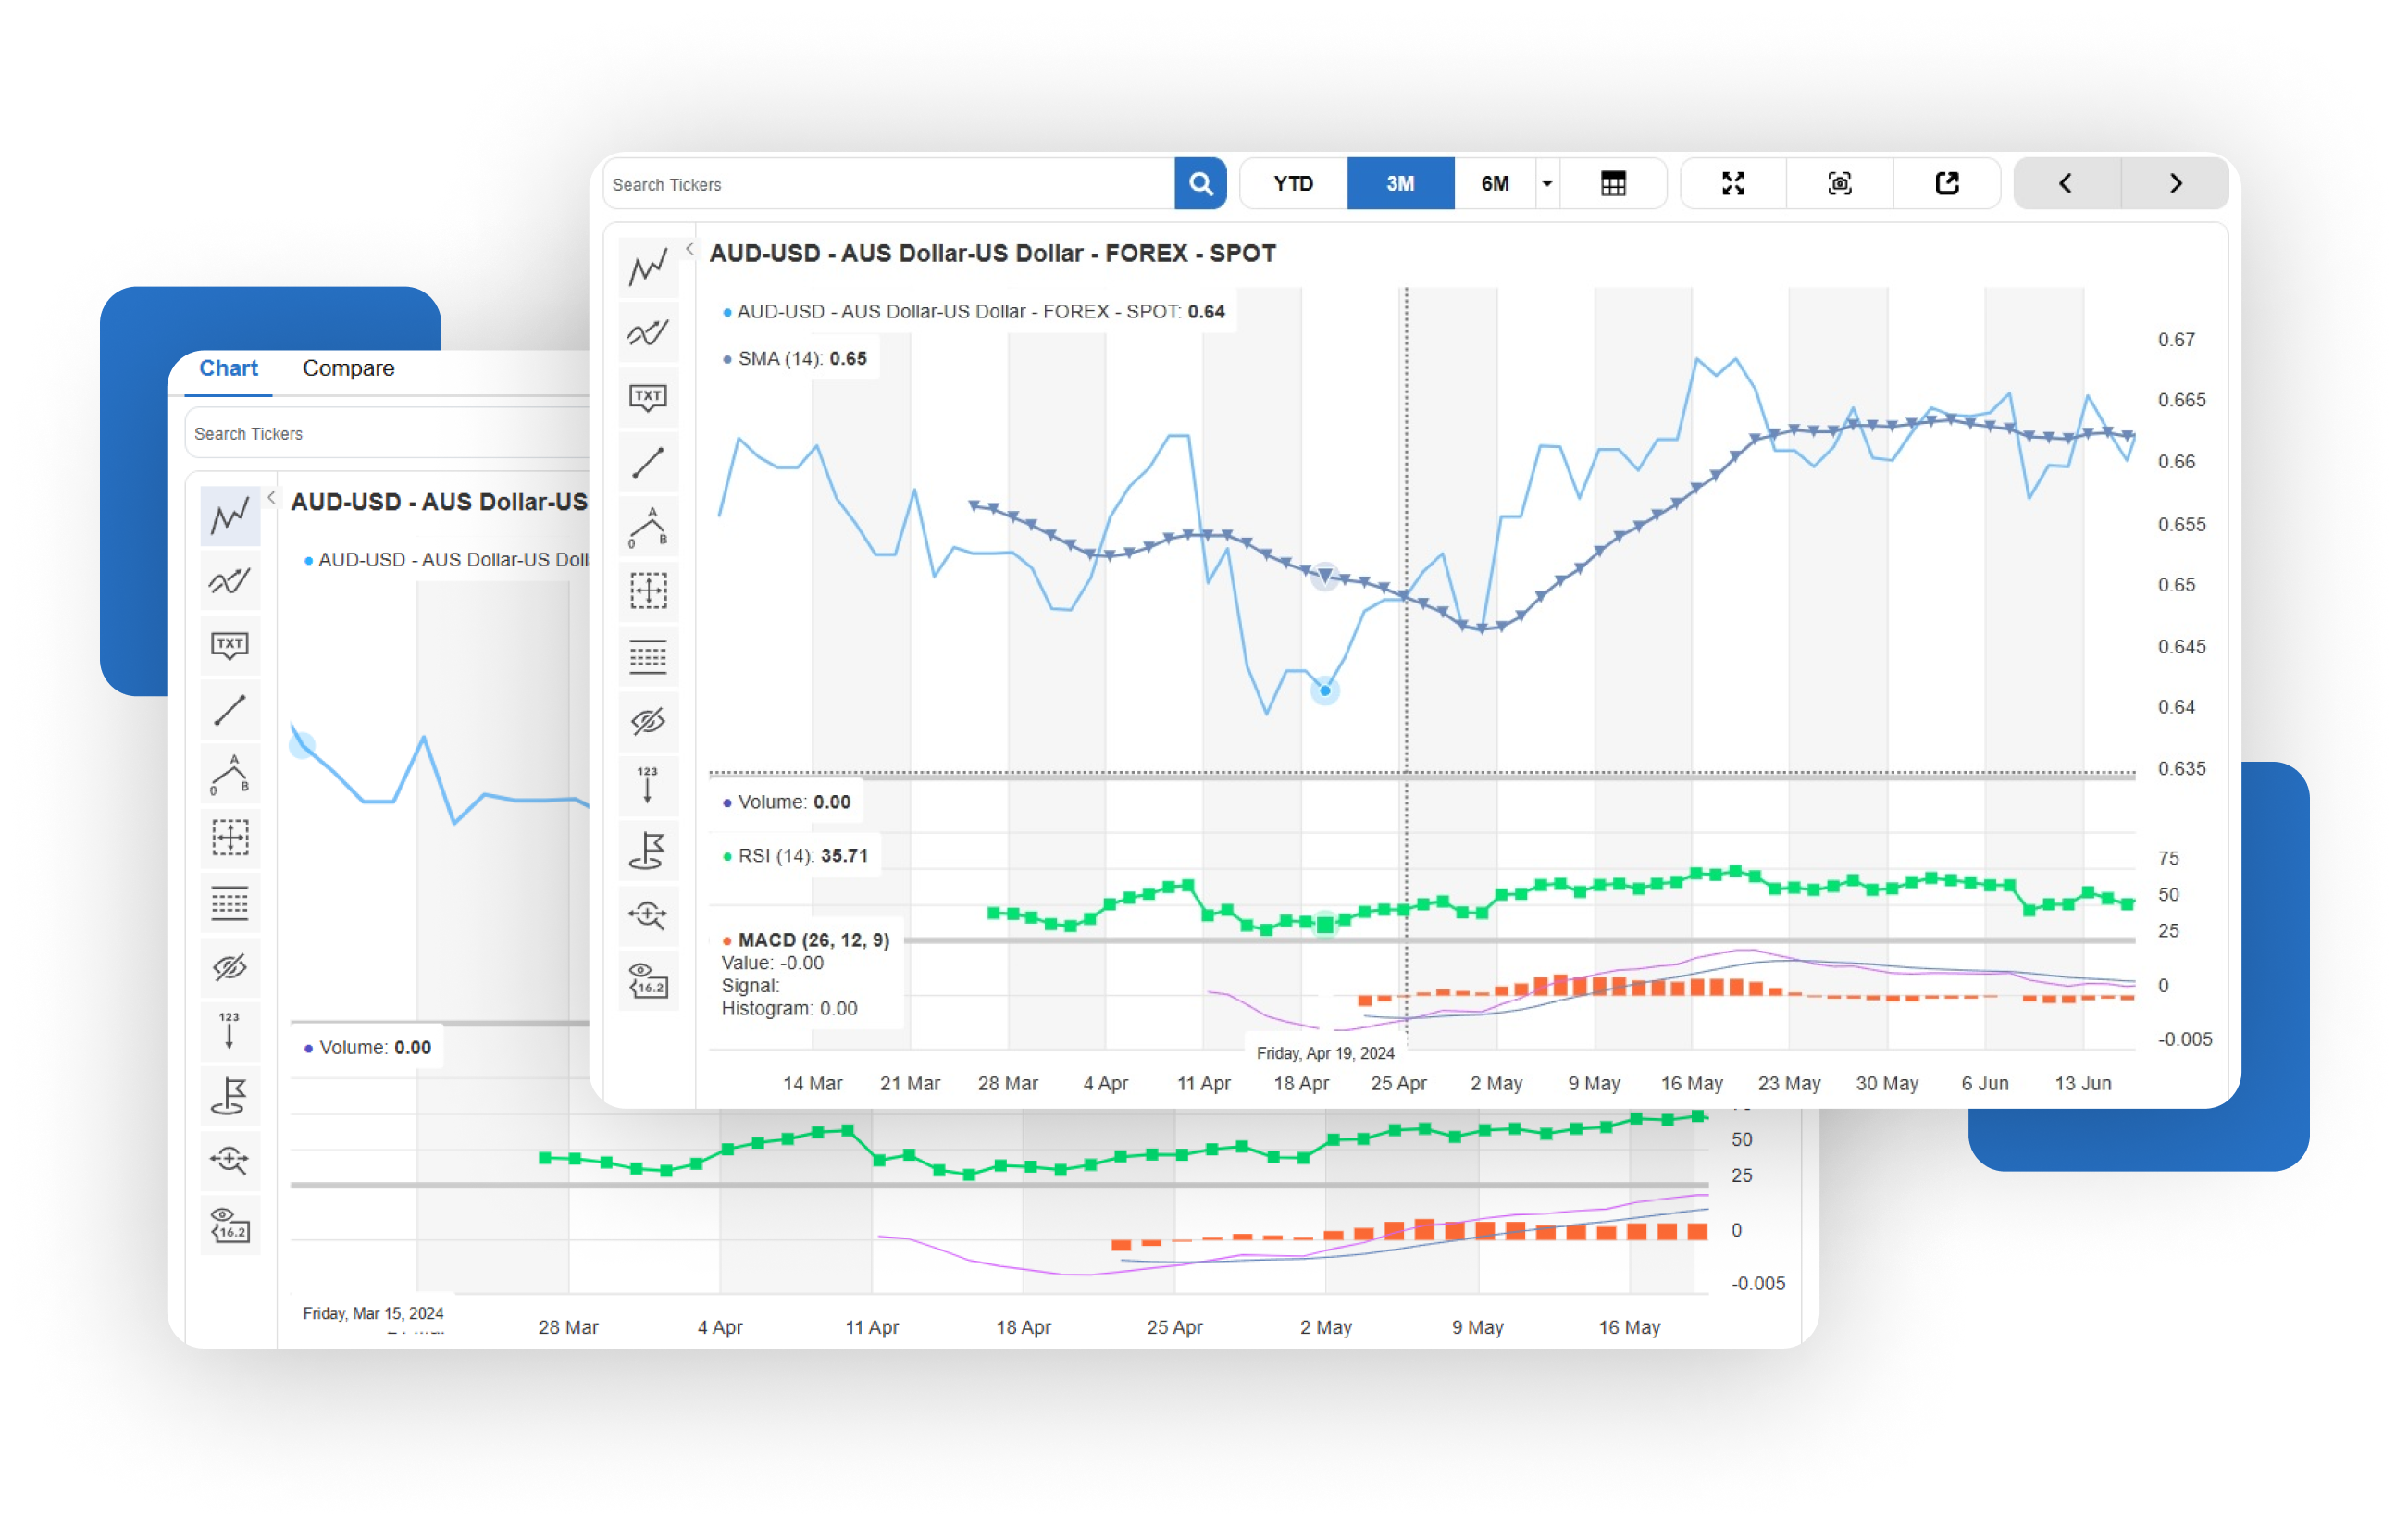
Our Advanced Charting Tool is designed to provide wealth managers & investors with a comprehensive suite of features that empower you to make informed decisions. Our charting tool is an interactive interface suitable for both beginners and advanced users. The user-friendly design makes it easy for anyone to navigate and utilize its powerful capabilities effectively. You can customize your analysis by adding shapes, lines, vertical labels, annotations, and flags to your charts, to highlight key price levels and patterns. Our tool’s customization options guarantee that you can personalize your charts to suit your specific requirements effectively.
Interactive and Dynamic Data Analysis
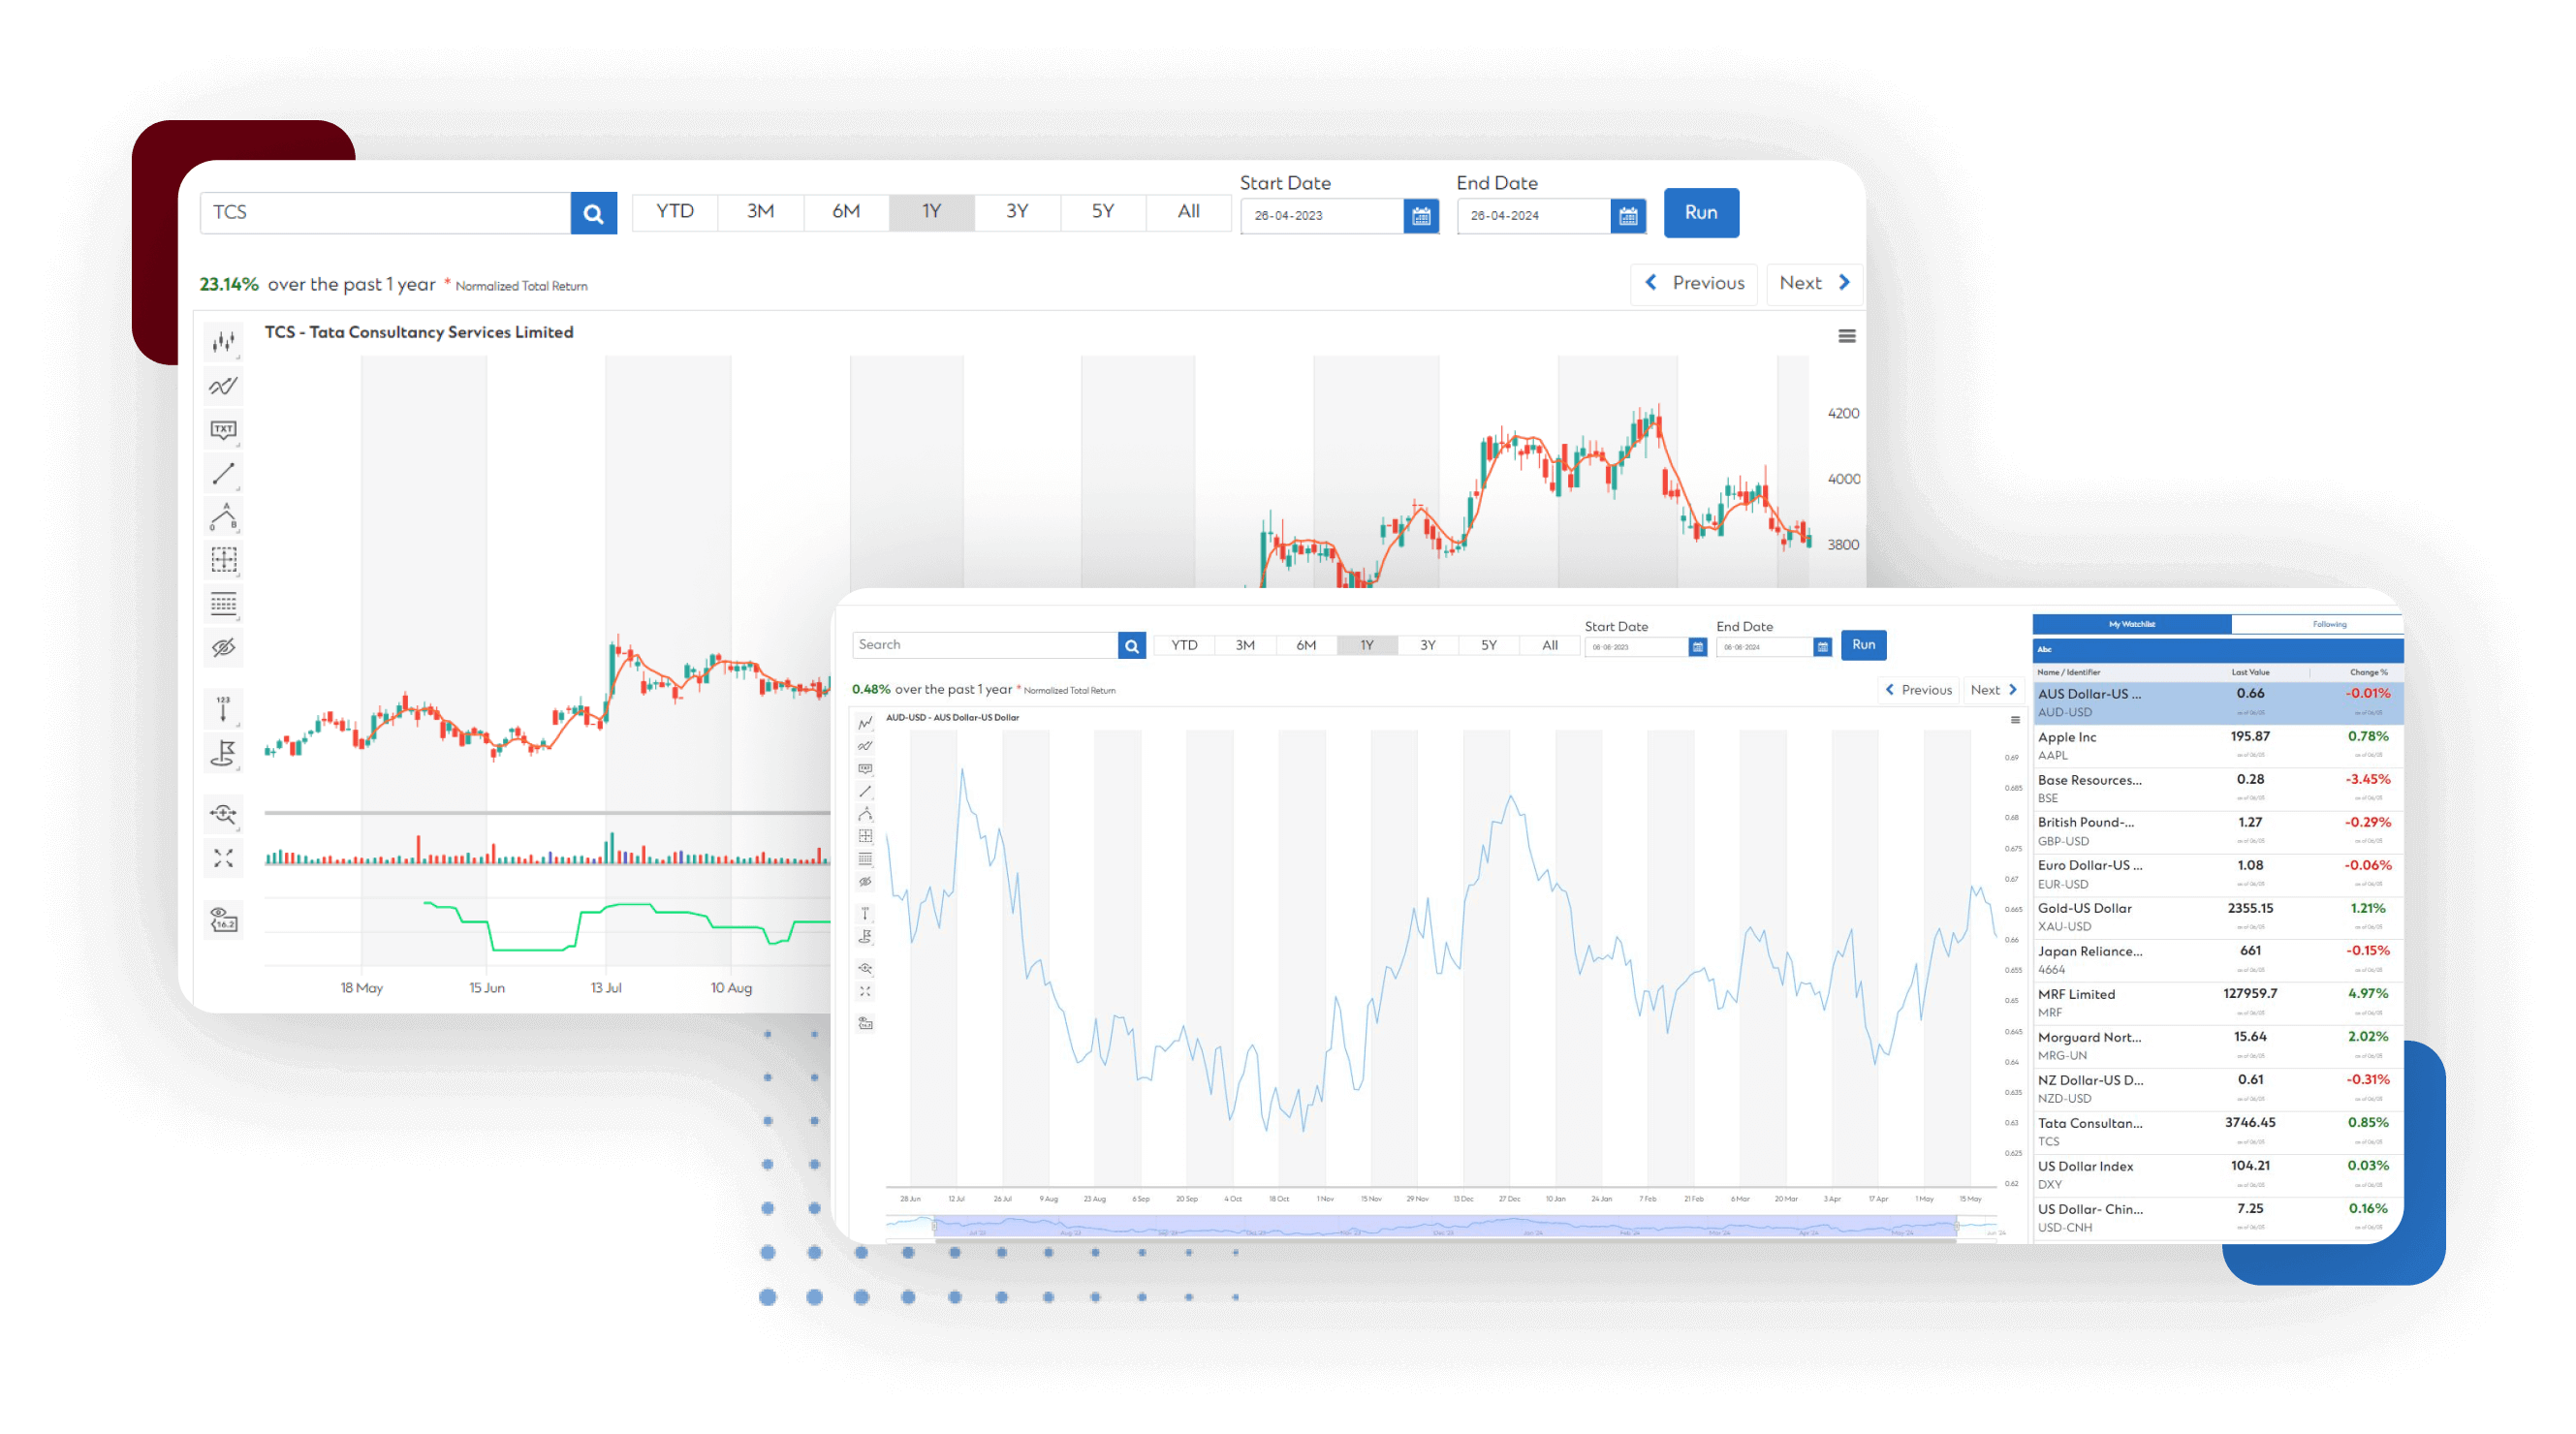
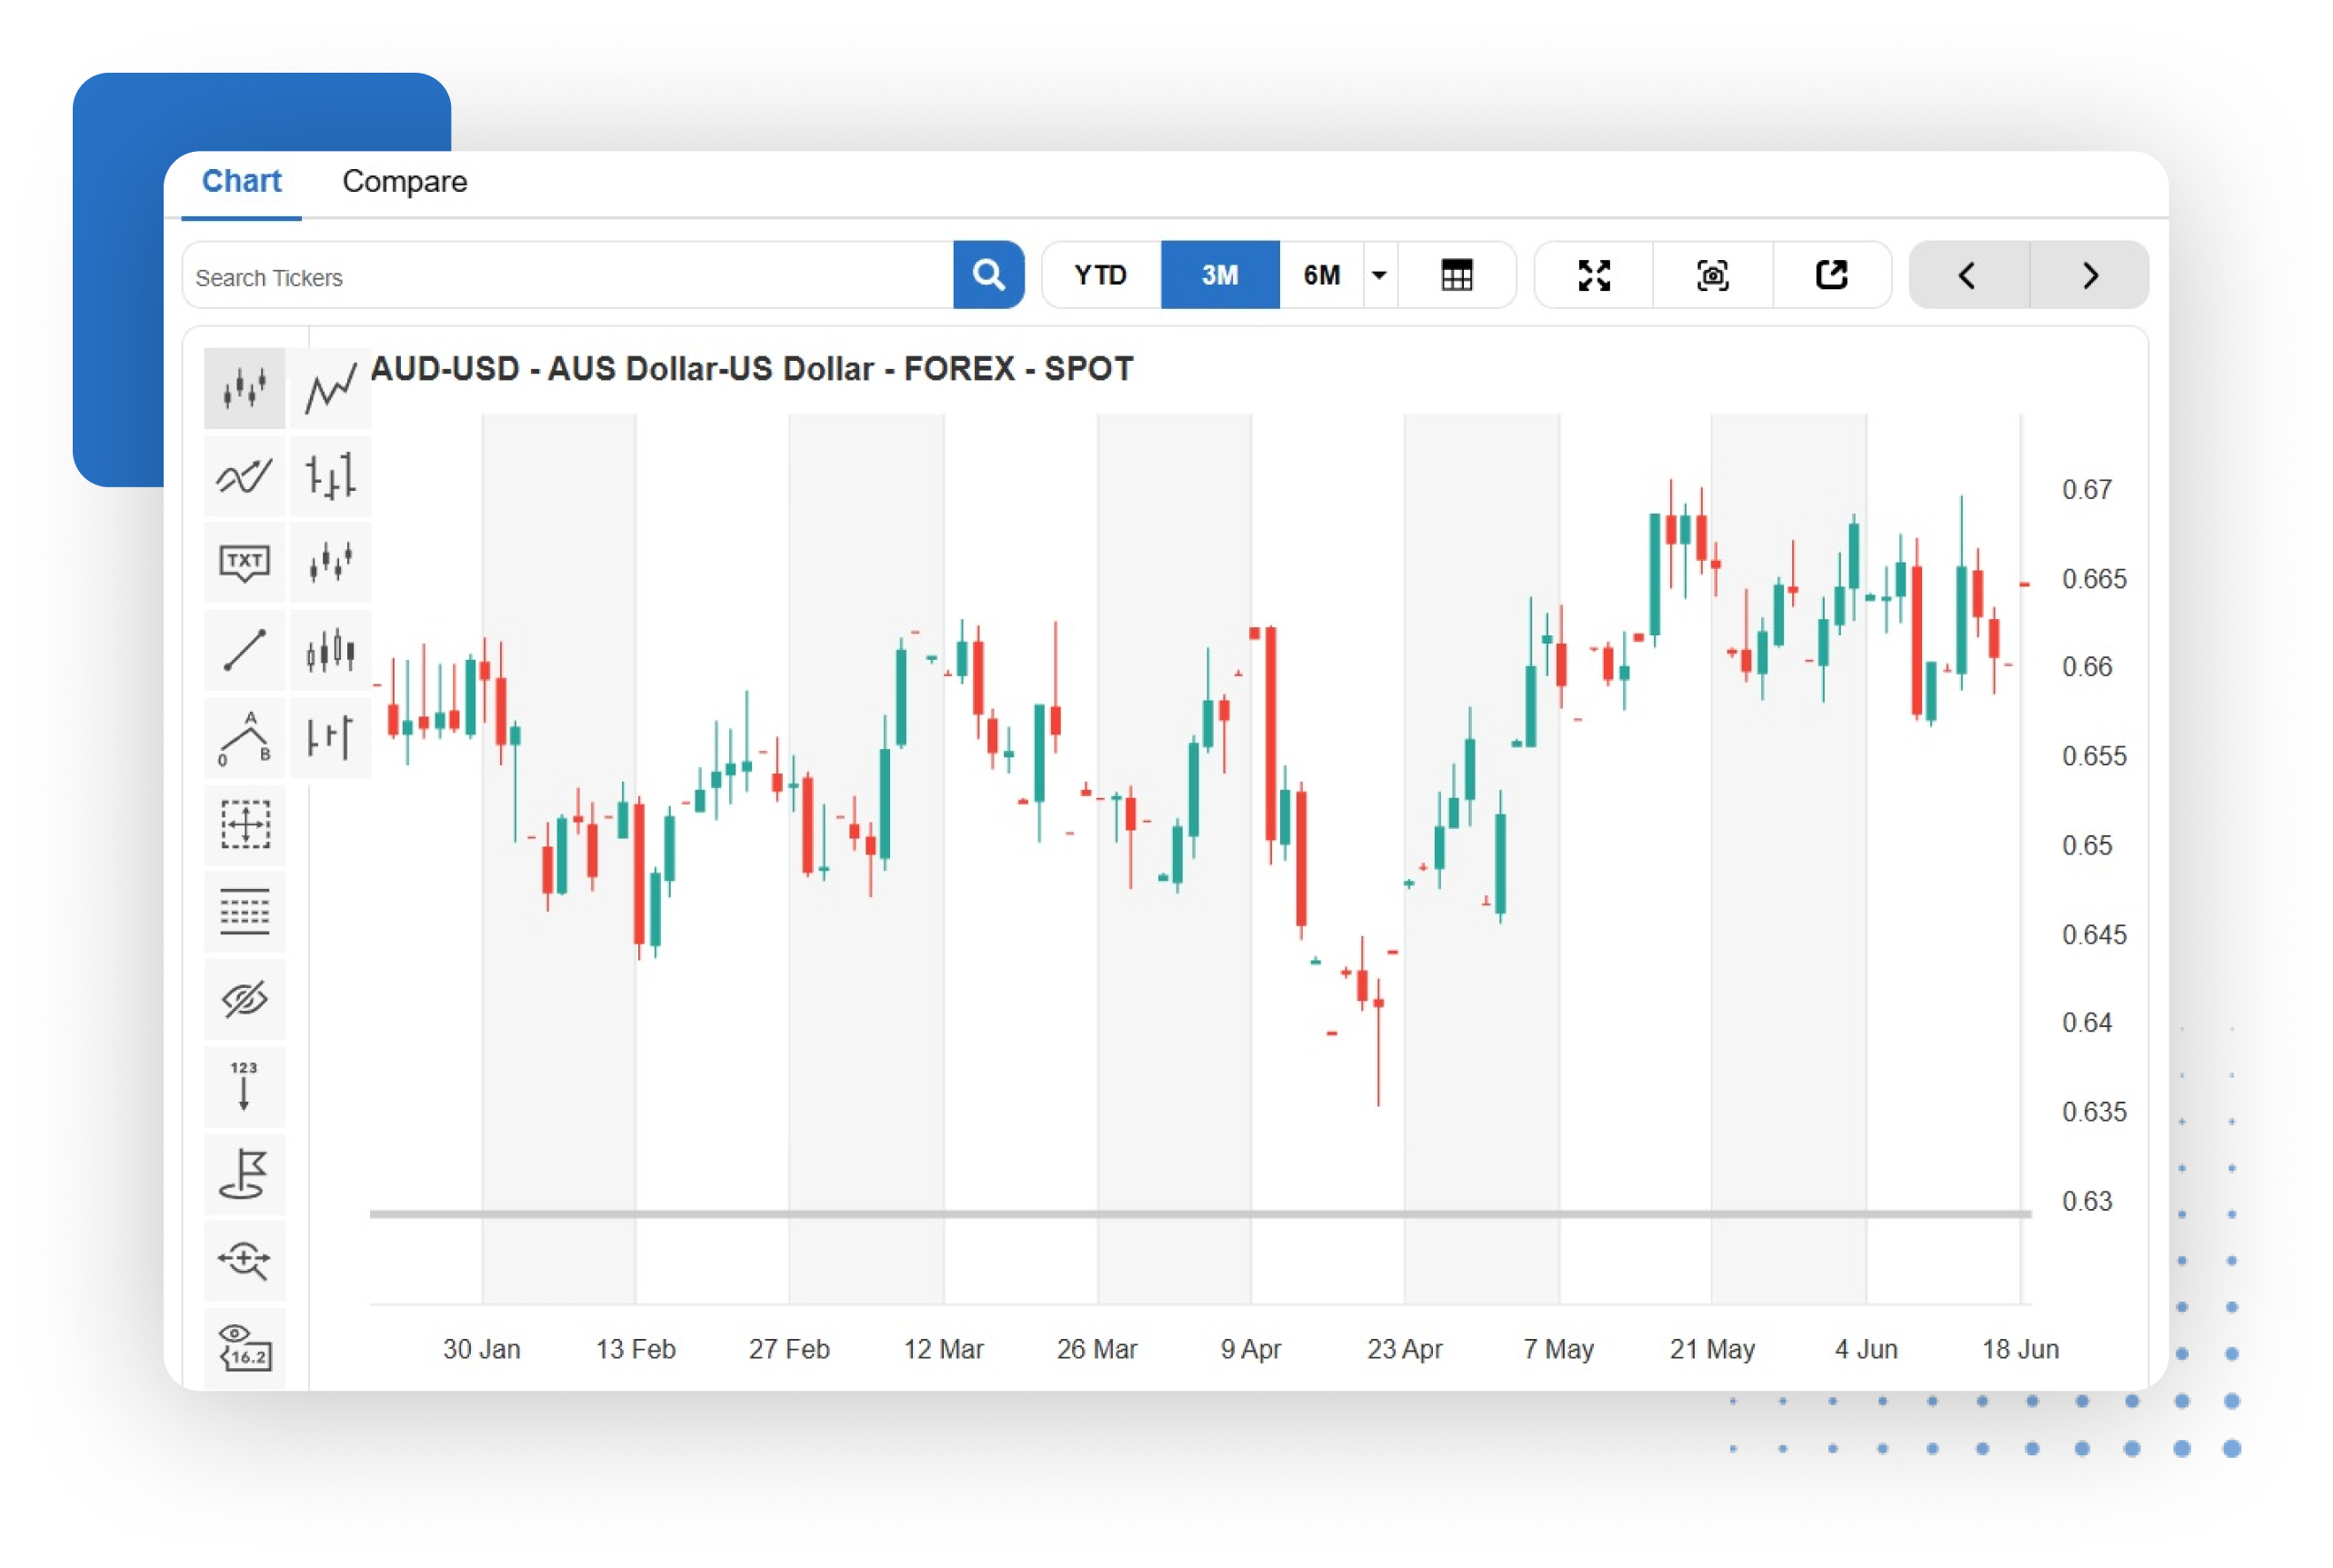
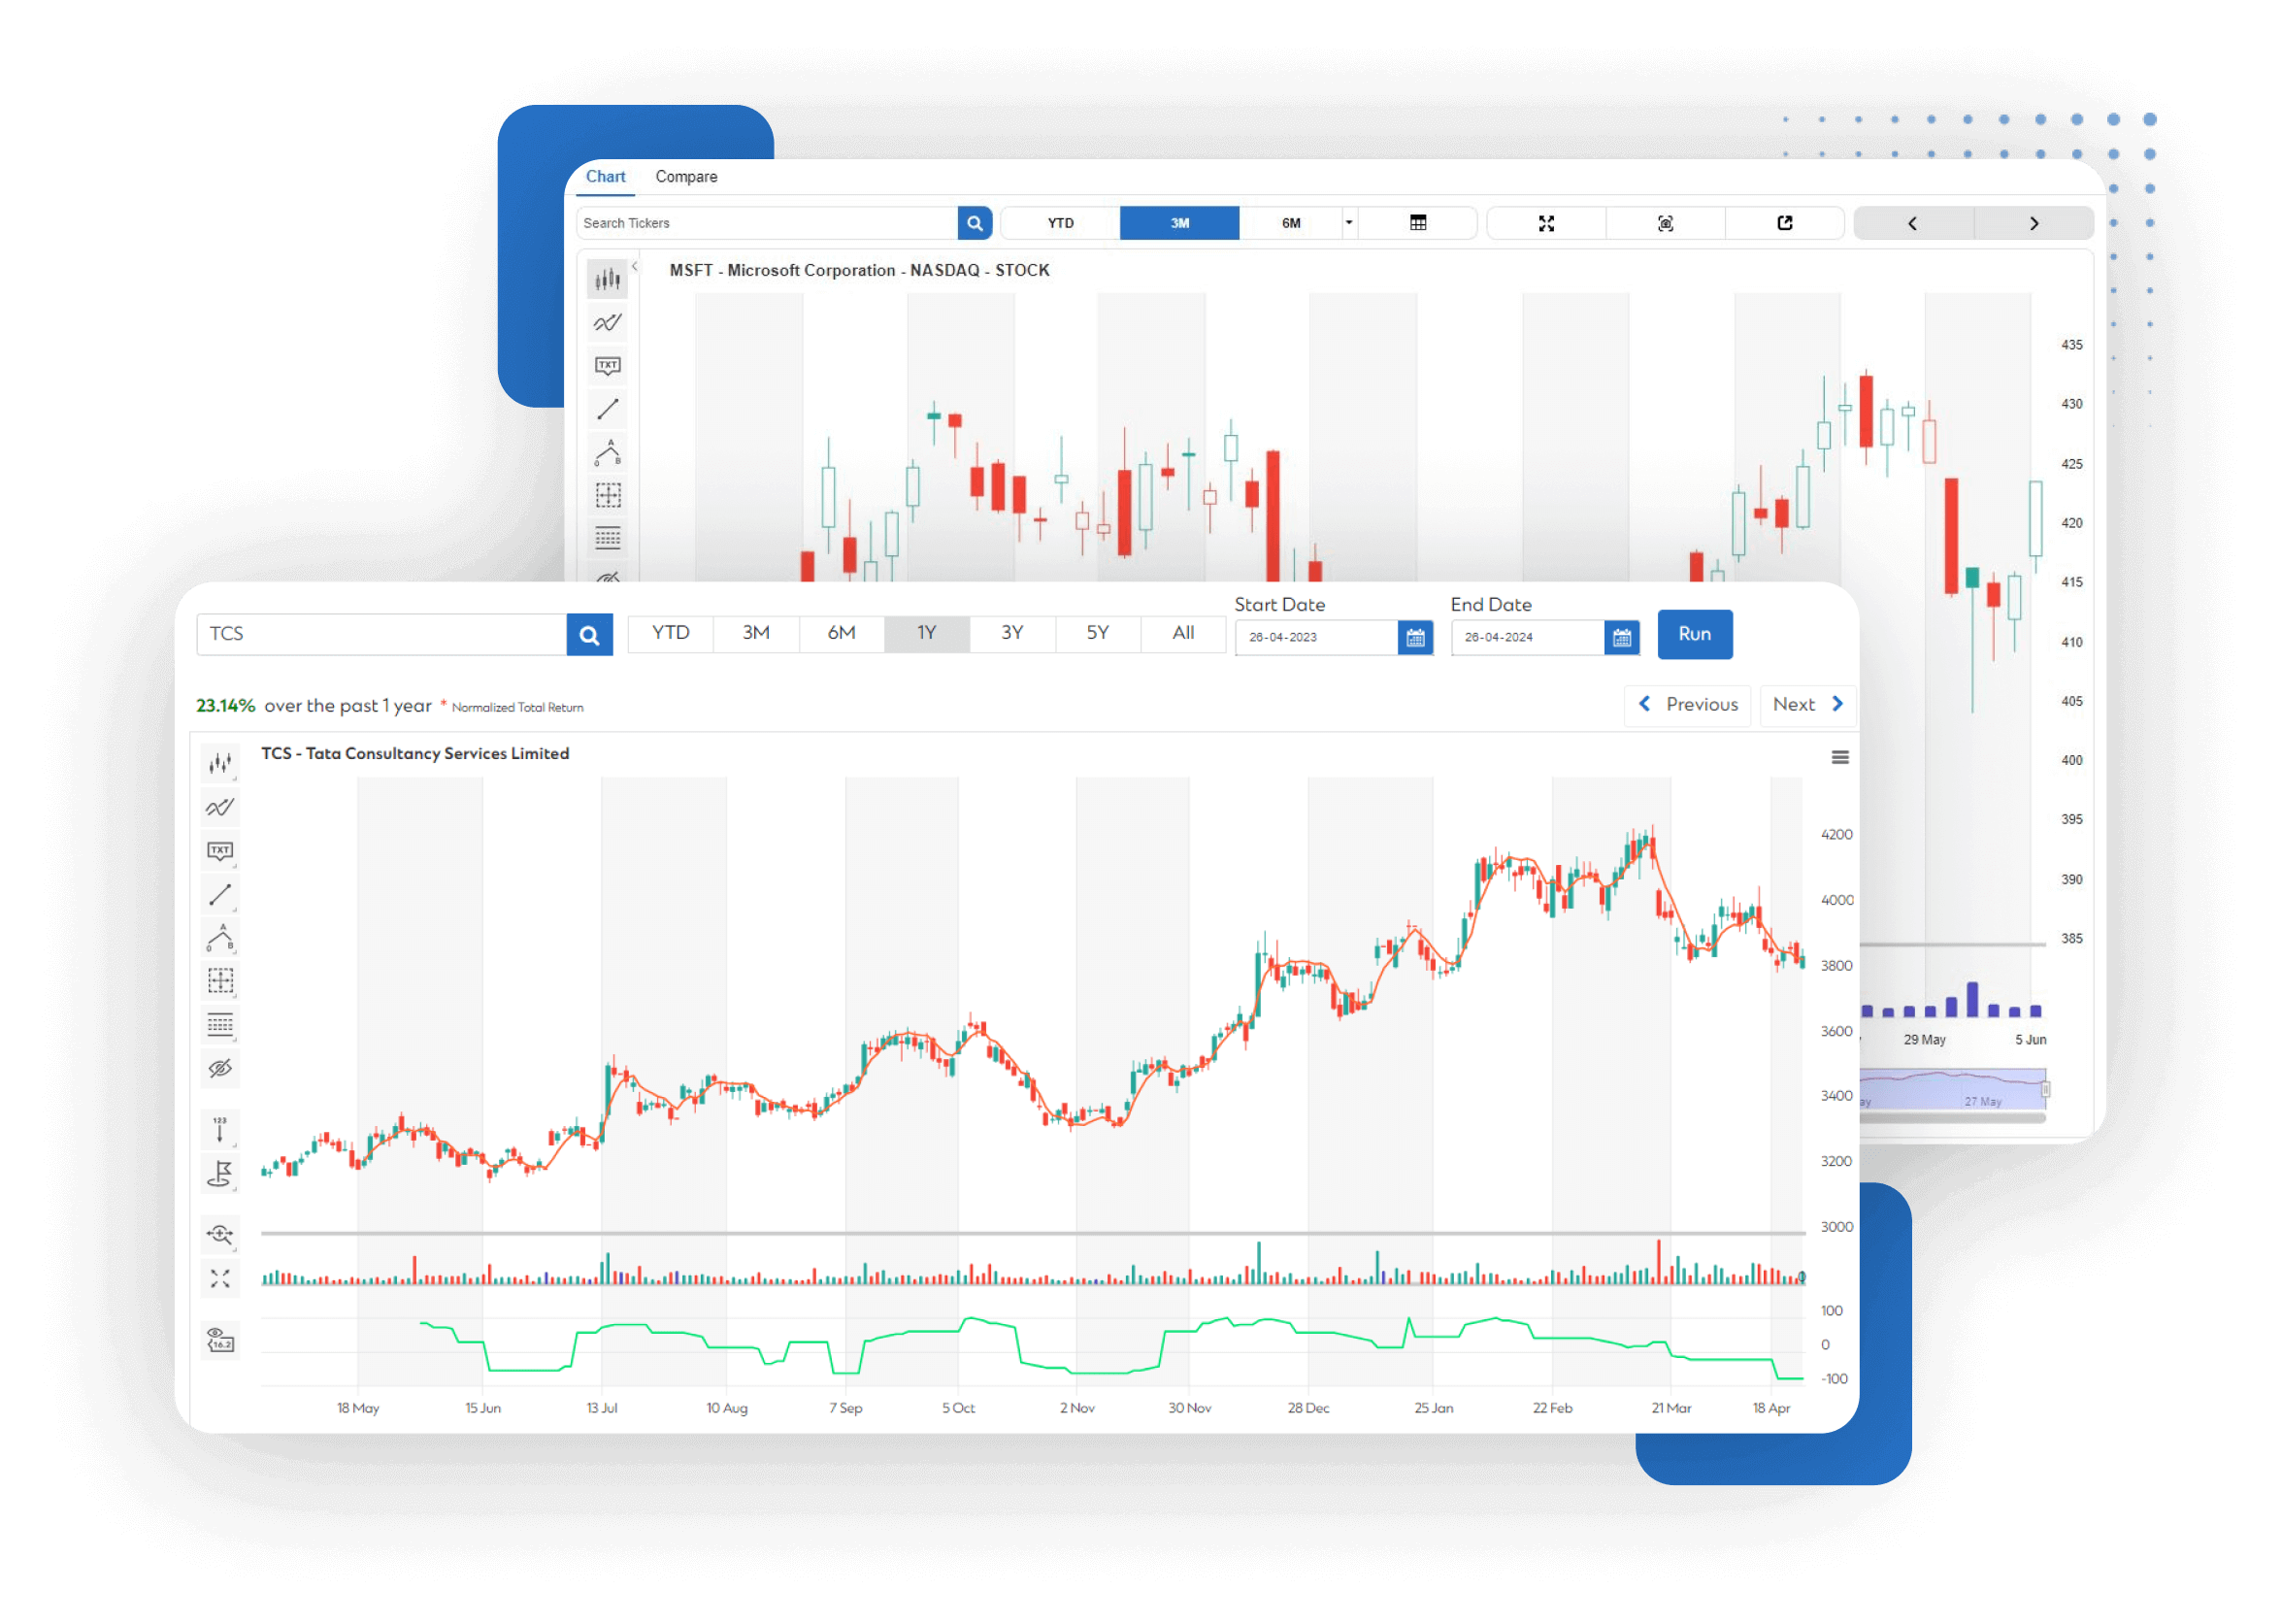
The tool provides interactive and dynamic detailed analysis of data seamlessly. You can export data and gain valuable insights to support your decision-making process. Our tool supports various chart types, such as OHLC, Line, Bar, Pie, Candlestick, Hollow Candlestick, and HLC to name a few. Each chart type is specifically crafted to present your data in the most efficient manner possible.
Comprehensive Technical Indicators
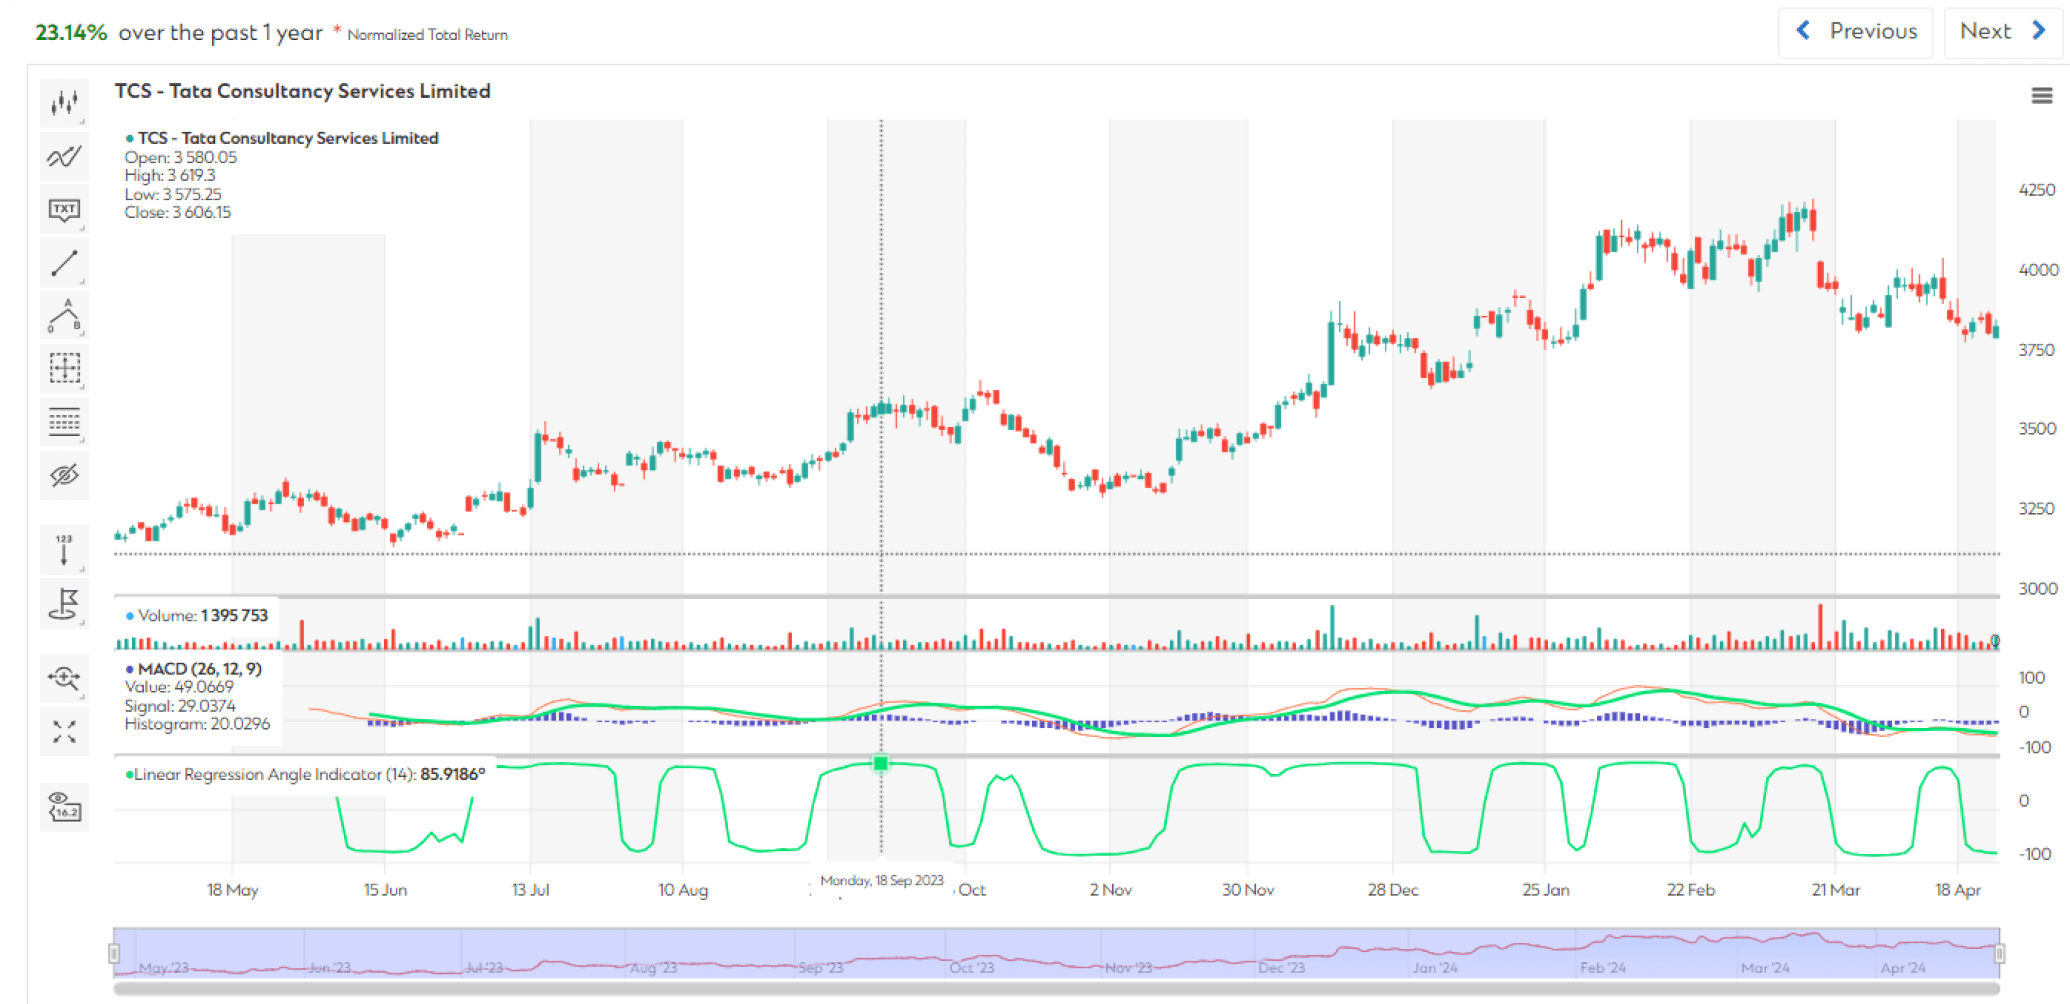
The charting tool helps you to tailor their graphs with a wide range of technical analysis indicators, creating charts to showcase fundamental and valuation metrics. You can elevate your market analysis with our wide array of technical indicators, including the Relative Strength Index (RSI), Moving Average Convergence Divergence (MACD), Simple Moving Average (SMA), Stochastic Oscillator, and many more. These indicators offer in-depth insights into market trends, empowering the users to make informed investment decisions.
Advanced Analytical Capabilities
You can utilize advanced features like Fibonacci Retracement, Pitchfork, Parallel Channel, and Time Circles in our charting tool. These tools facilitate comprehensive technical analysis and aid in identifying significant market trends.
Historical Data Examination
The users can effortlessly analyze historical data to uncover long-term trends and refine your investment strategies. Our charting tool enables you to visualize and interpret data over extended periods, providing a holistic view of market dynamics.
